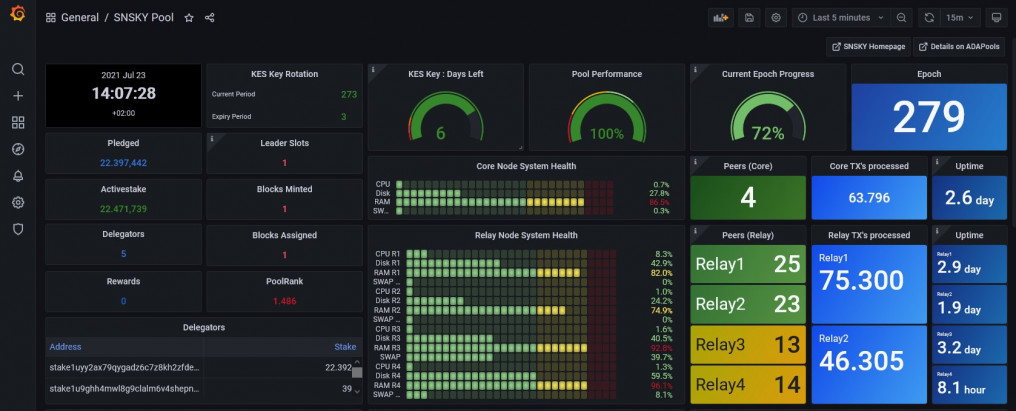
Once you have sucessfully set-up a Cardano pool, then comes the most beautifull part - setting up your Dashboard and Alerts! You surely dont want to gaze the PC whole day, or?
I found it difficult to get all the information at one place so am writing this documentaion and hopeully it helps others as well. This tutorial is for education and learning purpose only.
Prerequisites:
-
Ubuntu Server 20.04 LTS (for Ubuntu 18.04 LTS please follow the alternative steps)
-
Cardano Block Producer Node (PN) up and running
-
Cardano Relay Nodes (RN) up and running
1. Install prometheus node exporter
Firstly install Prometheus node exporter on the Block Producing and all Relay Nodes
for Ubuntu 20.04
$ sudo apt-get install -y prometheus-node-exporter

$ sudo systemctl enable prometheus-node-exporter.service
for Ubuntu 18.04 install node_exporter as prometheus-node-exporter does not expose all metrics
$ cd $HOME/git
$ wget https://github.com/prometheus/node_exporter/releases/download/v1.1.2/node_exporter-1.1.2.linux-amd64.tar.gz (choose your right server version)
$ tar xvfz node_exporter-1.1.2.linux-amd64.tar.gz

$ sudo cp node_exporter-1.1.2.linux-amd64/node_exporter /usr/local/bin

$ chown node_exporter:node_exporter /usr/local/bin/node_exporter

$ cd /etc/systemd/system

$ sudo nano node_exporter.service
Then, paste the following configuration for your service.
[Unit]
Description=Node Exporter
Wants=network-online.target
After=network-online.target

[Service]
User=<your user name>
ExecStart=/usr/local/bin/node_exporter
[Install]
WantedBy=default.target
Exit nano, reload your daemon, and start your service.
$ sudo systemctl daemon-reload

$ sudo systemctl start node_exporter

$ sudo systemctl enable node_exporter.service
NOTE
for Ubuntu 18.04 use from now on in the tutorial the node_exporter.service instead of prometheus-node-exporter.service
Update mainnet-config.json config files with new hasEKG and has Prometheus ports.
$ cd $NODE_HOME
$ sed -i config.json -e "s/127.0.0.1/0.0.0.0/g"

On PN you need to open ports 12798 and 9100

$ sudo ufw allow proto tcp from <RN IP address> to any port 9100

$ sudo ufw allow proto tcp from <RN IP address> to any port 12798

$ sudo ufw reload
restart the nodes
$ sudo systemctl restart <your node name e.g. cardano-node>
2. Install Prometheus on Monitoring Node
Install Prometheus on the Monitoring Node - the Node where the Grafana Server will run. This could be on of the Relay nodes or a separate dedicated node for monitoring.
$ sudo apt-get install -y prometheus
3. Install Grafana on Monitoring Node
$ wget -q -O - https://packages.grafana.com/gpg.key | sudo apt-key add -

$ echo "deb https://packages.grafana.com/oss/deb stable main" > grafana.list
$ sudo mv grafana.list /etc/apt/sources.list.d/grafana.list

$ sudo apt-get update && sudo apt-get install -y grafana
Enable services so they start automatically
$ sudo systemctl enable grafana-server.service
$ sudo systemctl enable prometheus.service
$ sudo systemctl enable prometheus-node-exporter.service
Update prometheus.yml located in /etc/prometheus/prometheus.yml
Change the ip address in the following command
$ cat > prometheus.yml << EOF
global:
  scrape_interval:     15s # By default, scrape targets every 15 seconds.

  # Attach these labels to any time series or alerts when communicating with
  # external systems (federation, remote storage, Alertmanager).
  external_labels:
    monitor: 'codelab-monitor'

# A scrape configuration containing exactly one endpoint to scrape:
# Here it's Prometheus itself.
scrape_configs:
  # The job name is added as a label job=<job_name> to any timeseries scraped from this config.
  - job_name: 'prometheus'

    static_configs:
      - targets: ['localhost:9100']

        labels:
          alias: 'relaynode1'
          type:  'cardano-node'

      - targets: ['<relay node 2 public ip address>:9100']

        labels:
          alias: 'relaynode2'
          type:  'cardano-node'
      - targets: ['<block producer public ip address>:9100']

        labels:
          alias: 'block-producer-node'
          type:  'cardano-node'
     - targets: ['localhost:12798']
        labels:
          alias: 'relaynode1'
          type:  'cardano-node'

     - targets: ['<relay node 2 public ip address>:12798']

        labels:
          alias: 'relaynode2'
          type:  'cardano-node'

     - targets: ['<block producer public ip address>:12798']
        labels:
          alias: 'block-producer-node'
          type:  'cardano-node'

EOF
if you have more than two RNs, add all your Relays as new “targets” in the config above
$ sudo mv prometheus.yml /etc/prometheus/prometheus.yml
restart the services
$ sudo systemctl restart grafana-server.service
$ sudo systemctl restart prometheus.service
$ sudo systemctl restart prometheus-node-exporter.service
Verify that the services are running properly
$ sudo systemctl status grafana-server.service prometheus.service prometheus-node-exporter.service
On the Monitoring Node open ports 3000 for Grafana
$ sudo ufw allow from <your home IP address from where you plan to access Grafana> to any port 3000
NOTE
Please refer to Grafana Labs Secuirty for hardening e.g. by default the communication with the Grafana server is unencrypted.
4. Setting up Grafana Dashboard
On RN, open http://localhost:3000 or http://your relaynode ip address:3000 in your local browser. Login with admin / admin Change password
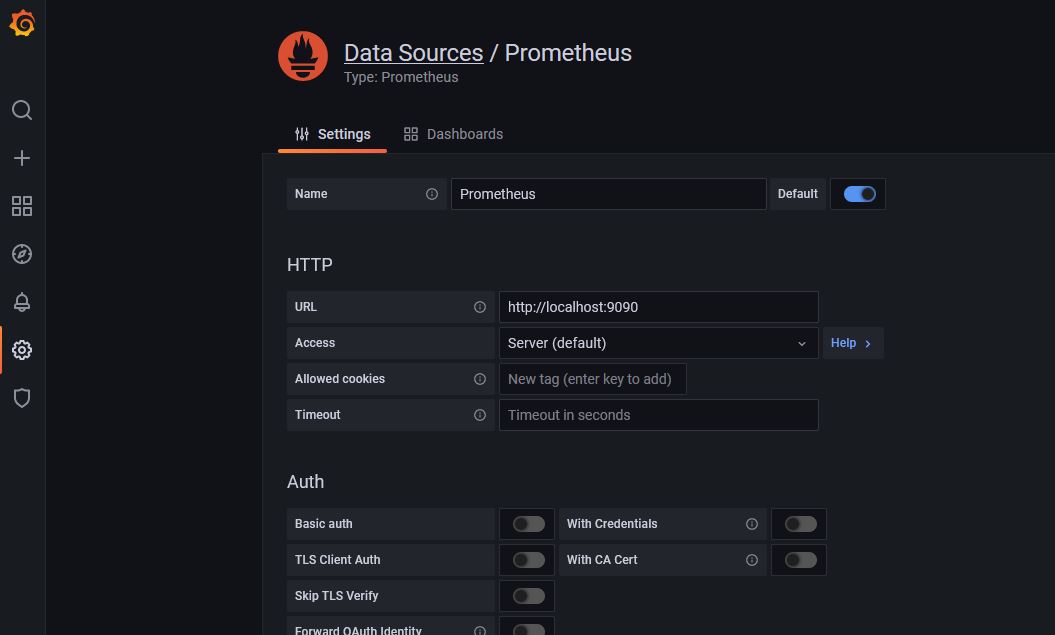
Click the configuration gear icon, then Add data Source Select Prometheus Set Name to “Prometheus” Set URL to http://localhost:9090 Click Save & Test
Download my Dashboard that you see on the top of this page, from the following GitHub link and save the JSON file
in Grafana, Click Create + icon (in left Menu) > Import Add dashboard by Upload JSON file Click the Import button.
If you nodes are in several time zones, it is usefull to add the Grafan Clock panel
$ grafana-cli plugins install grafana-clock-panel
Installed panels are available immediately in the Dashboards section in your Grafana main menu.
To see a list of installed panels, click the Plugins item in the main menu. Both core panels and installed panels will appear.
5. Add Data from Cexplorer to the Dashboard
Cexplorer provides an API where we can collect data for our pool. Run the following commands to create directory for our pool statistics and script.
Prometheus can work only with numeric data, so we must first trim non numeric strings which is returned from the JSON file. Lets create a shell script getstat.sh for the same
cd /$NODE_HOME

mkdir -p poolStat

cd poolStat

echo "curl https://js.cexplorer.io/api-static/pool/< YOUR POOL BECH 32 POOL ID >.json 2>/dev/null \\
| jq '.data' | jq 'del(.stats, .url , .img, .updated, .handles, .pool_id, .name, .pool_id_hash)' \\
| tr -d \\\"{},: \\
| awk NF \\
| sed -e 's/^[ \t]*/cexplorer_/' > poolStat.prom" > getstats.sh

chmod +x getstats.sh

./getstats.sh
check the content of adapools.prom and it should not contain only numeric values
$ nano poolStat.prom
Configure promethues-node-exporter.service to grab data from poolStat.prom file
$ sudo cp /lib/systemd/system/prometheus-node-exporter.service /lib/systemd/system/prometheus-node-exporter.service_backup

$ sudo nano /lib/systemd/system/prometheus-node-exporter.service
Change ExecStart line to
[Service]
ExecStart=/usr/bin/prometheus-node-exporter --collector.textfile.directory=< YOUR NODE FULL PATH >/poolStat --collector.textfile
The default user of prometheus-node-exporter is “prometheus”. Either give the user “prometheus” read and execute rights for poolStat.prom, or alternatively you could change the default user to your user name in prometheus-node-exporter.service:
[Service]
User=<Linux User Name>
Reload daemon and restart services
$ sudo systemctl daemon-reload

$ sudo systemctl restart prometheus-node-exporter.service

$ sudo systemctl restart prometheus.service
Now you should see in the Dashboard all Cexplorer statistics
Since the statistics will change, lets set cron job to update data from Cexplorer everyday
$ crontab -e
##############################

#Get data from ADApools every day at 06:00

0 6 * * * <YOUR NODE FULL PATH >/poolStat/getstats.sh

##############################
Done!
6. As last step let’s now setup Grafana Alerting and Email Notifications
Setup SMTP in Grafana
$ sudo nano /etc/grafana/grafana.ini
Edit the SMTP section
#############################

[smtp]
enabled = true
host = smtp.<email server>:465
user = <email user name>
# If the password contains # or ; you have to wrap it with triple quotes. Ex """#password;"""
password = <email password>
from_address = sam@sanskys.de
from_name = Grafana

#############################
Login to Grafana with username and password.
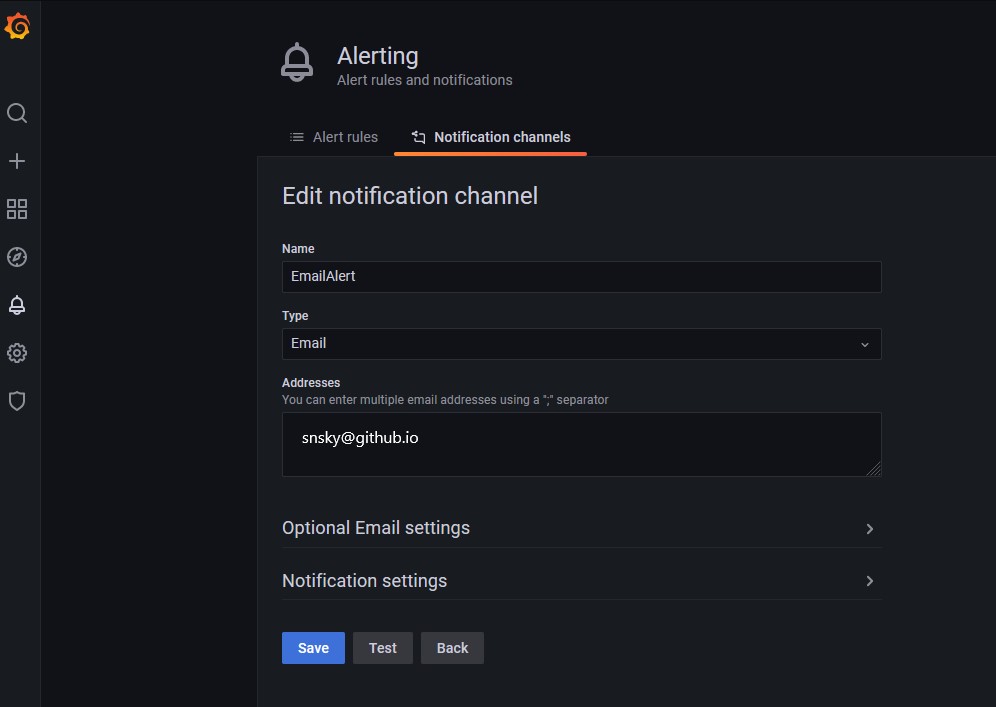
Click on the “Bell” icon on the left sidebar.
Select “Notification channels.”
Click on “Add Channel.” This will open a form for adding new notification channel.
Give a name to this channel. I am using “Alert”
Select Email from “Type” as we want to send notifications over email.
Check the “Send on all alerts” in case you want email on all alerts.
Select the checkbox of “Include image” in case you want to include the image of the panel as the body in the notification email.
Add the target email in “Email addresses” text area. You can use multiple email address separated by “;”
Click on “Send Test” if you want to verify your settings. This will send a sample email using the SMTP details we configured earlier.
Click on “Save” to add this channel
Create an Alert if Block Producer is not reachable
Please not that Alerts can only be created for “Graph” panels!
Now we create an Alert to get an email if the PN is not reachable
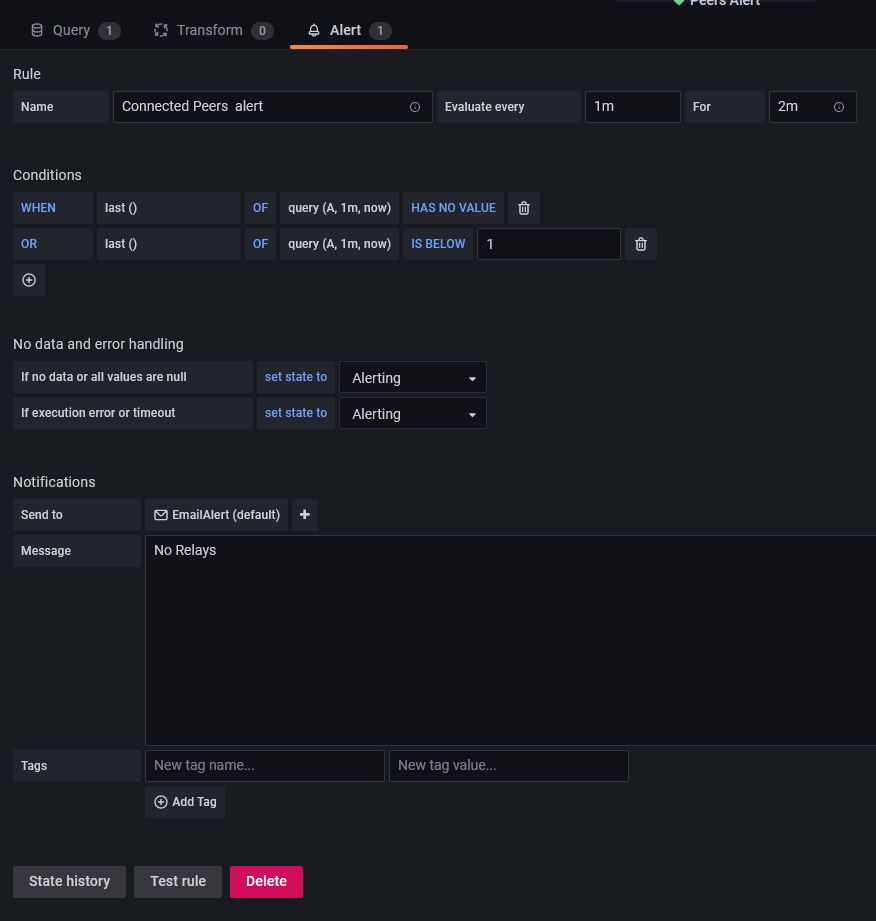
In the “Connected Peers” panel go to Alerts
Define the Rule “Connected Peer Alert” Evaluate every “1m” For “2m”
Condition
WHEN "last()" OF "query(A, 1m, now)" "HAS NO VALUE"
No Data & Error Handling
If no data or all values are null SET STATE TO “No Data”
If execution error or timeout SET STATE TO “Alerting”
Notifications
Send To - Choose your notofication channel, which in my case is “Alert”
Message - type in your alert message that should appear in the email
Press on “test Rule” to ensure that the Alert is correct and has no issues.
Now you are done! Stop you PN and you should get an Alert within 4min.
NOTE
If everything works, now you should have a smile on your face! And if you wish to support the Tutorial work, you could donate or delegate to my pool - SNSKY
Donation Address
addr1qyyhd8cpv4gmhr5axerhezhtzldrw4rp9ayf0fc6arnme4cg46du2qg366943uy0dw5yjmna7arfw265lu4r2fjccl4scf7xrw

SNSKY Pool ID

075578defd7ee97cbeaa2937e5819099cb3835ac9f9c8b1a2c3a3578
7. Recommended: Disabling Grafana Registrations and Anonymous Access
We should make Grafana a bit more sucure and to do so lets change two settings
$ sudo nano /etc/grafana/grafana.ini
Locate the following allow_sign_up directive under the [users] heading and change the line to as follows
##########

[users] # disable user signup / registration

allow_sign_up = false

##########
Next, locate the following enabled directive under the [auth.anonymous] heading and change the line to as follows
[auth.anonymous]

enabled = false
Save the file and exit your text editor and to activate the changes, restart Grafana.
$ sudo systemctl restart grafana-server
8. Advanced Users: Slot Leader Panel
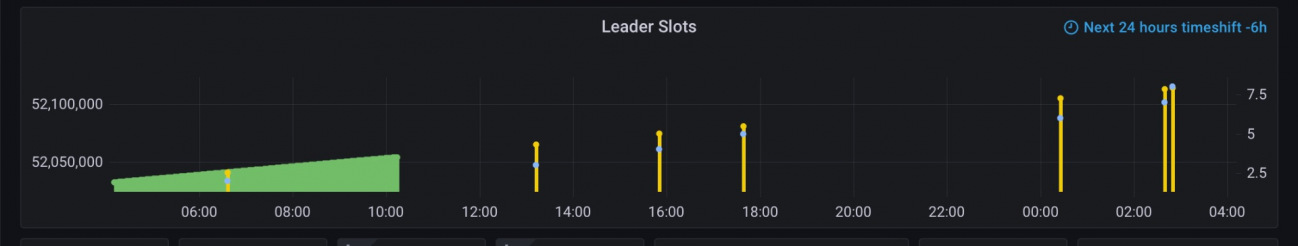
Once your Pool gets big and is regularly minting blocks, it becomes diffcult to keep track of all Leader Slots and also to identify the available gaps for Pool maintainance. This Slot Leader Panel is quite helpful as it gives a good overview of all scheduled Slots in TimeSeries.
Use cardano-cli to query the leadership schedule. Since the result has to interpreted by Grafana, we need to format the query output to a CSV readable syntax.
NOTE
The cardano-cli query requires addtional RAM. I needed 16GB RAM + 8GB SWAP and it took several minutes to query the leadership schedule.
The whole script can be copied from here:
In case the slot.csv file is on a different node, copy it to your Grafana Monitoring node manually. This step could be automated but I dont wish to open extra ports for this so I just copy and paste the content of the slot.csv file.
Next, we add the CSV Plugin to Grafana. Please follow the instructions under the section “Installing on a local Grafana:”
After the installation, in Data Sources now the CSV Plugin should be listed. Configure the CSV Plugin by specifying the location of the slot.csv file. Save & Test and if all steps were followed correctly, you should get the green sucess messsage.
Reading files from the local file system is disabled by default. To allow local mode, add the following to your Grafana config file:
[plugin.marcusolsson-csv-datasource]
allow_local_mode = true
The final step is to add the Slot Leader Panel to your dashboard. For that click on the “Add Panel” and “Add New Panel” icons.
Then click on “Query inspector” and and “JSON” buttons.
Delete the existing JSON code and replace it with the following:
Now click on “Apply” and thats it! You should be able to see all your Leader Slots from last 6 Hrs to next 18 Hrs and this time window shifts automaically.
Happy minting!